-1.png?width=134&height=66&name=amwhiz-logo%20(1)-1.png)


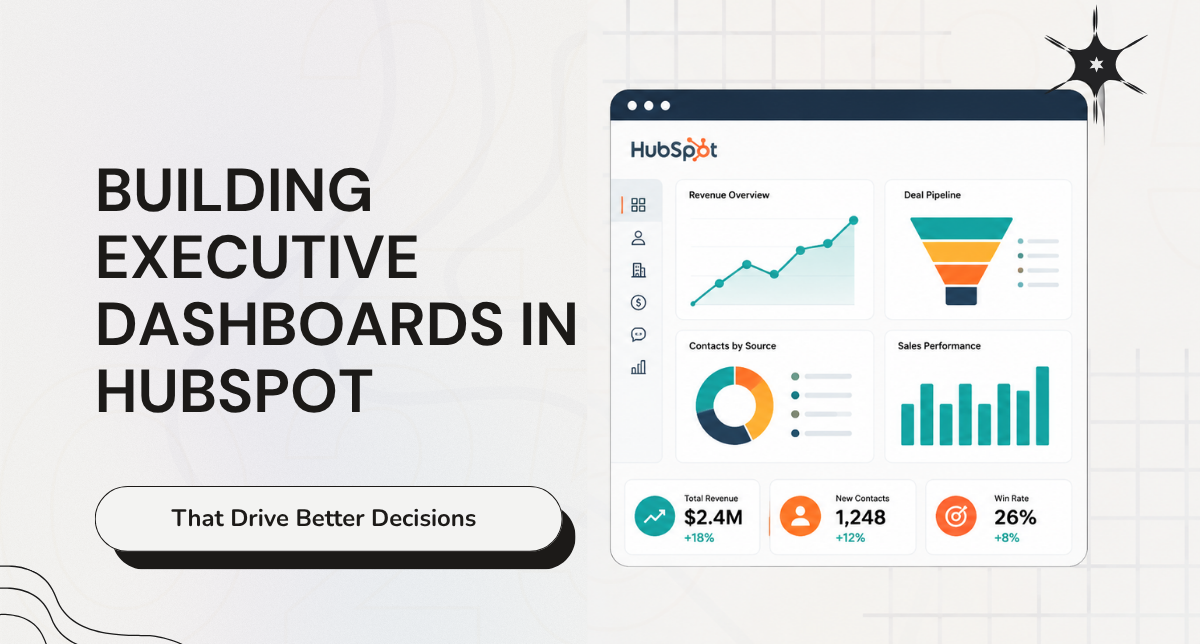

Overview Did you know, according to a report published by McKinsey Global, businesses that utilize...
written by: Renuka M
Business Intelligence,
Data Visualization,
performance metrics,
key indicators,
decision making,
reporting strategy,
kpi tracking,
business analytics,
leadership insights
Building Executive Dashboards in HubSpot That Drive Better Decisions
Your executive team makes decisions based on gut feeling. "I think sales is down." "Revenue feels slower this month." They make million dollar decisions without real data. Sometimes they're right. Often they're wrong. Decisions based on guesses cost money.
You have data in HubSpot. Thousands of contacts. Hundreds of deals. Millions of data points. But executives don't access it. Data sits in reports nobody looks at. Executives make decisions without seeing data.
Executive dashboards change this. They surface critical data at a glance. Executives see real time metrics. They make data driven decisions. Better decisions drive better results. Revenue grows. Margins improve. Forecasting accuracy increases.
Why Executive Dashboards Matter
Executives are busy. They don't have time to dig through reports. They need one page view of business health. Dashboard shows if business is on track or off track. Shows if action is needed. Shows where to focus.
Dashboards also enable delegation. CEO doesn't need to know every detail. But they need to know key metrics. VP of Sales doesn't need to know every deal. But needs to know pipeline and forecast. Dashboards give right info to right person.
Dashboards also drive accountability. Everyone sees targets. Everyone sees if team is on track. Transparency drives performance. Teams know their metrics matter.
Essential Executive Dashboard Metrics
Revenue Metrics
Year to date revenue. Revenue versus target. Month over month growth. Revenue by product. Revenue by segment. These metrics answer: are we making money? Are we on track?
Pipeline Metrics
Total pipeline value. Pipeline by stage. Pipeline by rep. Expected close date. Win probability. These metrics answer: do we have enough opportunity to hit target?
Sales Performance Metrics
Number of deals closed this month. Average deal size. Sales cycle length. Win rate. These metrics answer: are we selling effectively?
Customer Metrics
Total customers. New customers this month. Churn rate. Customer lifetime value. Net revenue retention. These metrics answer: is our customer base growing?
Efficiency Metrics
Customer acquisition cost. Sales productivity per rep. Support tickets per customer. Onboarding time. These metrics answer: how efficient are our operations?
Building Executive Dashboards in HubSpot
Step 1: Define What Success Looks Like
What metrics define success for your business? Revenue target? Pipeline target? Customer growth target? Define the metrics that matter. These become your dashboard metrics.
Step 2: Identify Audience
Who uses this dashboard? CEO needs different metrics than VP Sales. CFO needs different metrics than VP Customer Success. Design dashboard for specific audience.
Step 3: Choose Visualizations
How do you show metrics? Number card for key metric. Line chart for trends. Bar chart for comparisons. Gauge for progress toward target. Choose visualization that makes data clear.
Step 4: Set Thresholds
What's good? What's bad? Green if revenue is on track. Red if it's below target. Thresholds draw attention to problems. Executives see at a glance if action is needed.
Step 5: Build Dashboard
Use HubSpot dashboard builder. Add widgets for each metric. Arrange for visual clarity. Make it scannable. Key metrics should be visible without scrolling.
Step 6: Share and Update
Share dashboard with audience. Walk them through it. Explain the metrics. Update regularly. Dashboards are only useful if data is current. Schedule weekly or monthly updates depending on frequency of decision making.
Best Practices for Executive Dashboards
Keep It Simple
Don't put 50 metrics on one dashboard. 5 to 10 metrics maximum. Too much information is same as no information. Executive dashboards should be scannable in 2 to 3 minutes.
Focus on Outcomes Not Activities
Don't show number of calls made. Show revenue generated. Don't show number of emails sent. Show leads qualified. Executives care about outcomes not activities.
Show Trends Not Just Current
Show revenue this month and trend for year. Show pipeline and month over month change. Trends matter more than snapshots. Trends show direction.
Compare to Target
Revenue of 100k means nothing without target. Revenue of 100k against target of 150k shows we're off track. Always show metrics against target or forecast.
Drill Down Capability
Dashboard shows summary. Executive can drill down to details if needed. Example: dashboard shows revenue by segment. Executive can click to see revenue by customer within segment. Drill down enables investigation.
Common Executive Dashboard Mistakes
Too Many Metrics
Dashboard shows 40 metrics. Executive can't digest. Can't make decisions. Pare down to critical 5 to 10 metrics.
Data Not Current
Dashboard shows data from two weeks ago. Executive makes decision based on stale data. Bad decision. Keep data current. Daily or weekly refresh at minimum.
Missing Context
Metric shows revenue is 100k. But executive doesn't know if that's good or bad. No target. No historical comparison. Add context. Show target. Show trend. Show comparison.
Poor Visualization
Metric is pie chart when it should be bar chart. Or line chart when it should be number card. Wrong visualization makes data hard to understand. Choose visualization that makes message clear.
FAQ About Executive Dashboards
How many dashboards should I create?
Start with one. CEO dashboard showing overall business health. Once that's working, create role specific dashboards. VP Sales dashboard. VP Marketing dashboard. VP Success dashboard. Each role has different metrics. But don't create too many. Most organizations need 3 to 5 key dashboards.
Should dashboards be real time or batch updated?
Depends on frequency of decision making. Revenue dashboard can update daily. Operational dashboard can update hourly if decisions are frequent. Some metrics need real time. Some are fine daily. Find balance between currency and system load.
Who should have access to executive dashboards?
Executives obviously. But also managers and individual contributors. Transparency drives performance. When team sees target and knows if team is on track, performance improves. Everyone should see relevant metrics for their role.
What if executives don't look at dashboards?
Dashboards are only useful if people use them. If executives aren't looking, ask why. Too many metrics? Wrong metrics? Not user friendly? Get feedback. Fix the dashboard. Or schedule time for executive to review dashboard together.
Can I integrate external data into dashboards?
Yes. If you have data in systems outside HubSpot, can you integrate it? Sometimes. HubSpot has connectors to many systems. Data flows in. Can appear on dashboard. Not all data can be integrated. Know your limitations.
How do I handle confidential metrics?
Some metrics are confidential. Individual salesperson's compensation. Customer profitability by account. CEO-only financial projections. Use HubSpot permissions to limit access. Only let appropriate people see confidential metrics.
What if different departments disagree on metrics?
Sales thinks close rate is most important. Finance thinks revenue matters most. Both are right. Create department dashboards with their metrics. Also create company dashboard with metrics everyone agrees on.
Should I include leading or lagging indicators?
Both. Lagging indicators show what happened. Revenue. Customers closed. Leading indicators show what's coming. Pipeline. Qualified leads. Leading indicators help predict future. Lagging indicators show current reality. Include both.
How often should I review dashboard design?
Quarterly. Is this still the right metric? Should we change this visualization? Is there a metric we're missing? Business changes. Dashboards should evolve with business. Quarterly review keeps dashboards relevant.
Ready to Build Executive Dashboards That Drive Decisions?
Executive dashboards transform data into insight. Executives make better decisions. Teams perform better. Business grows faster. The power of dashboards lies in visibility and accountability.
At Amwhiz, we're a HubSpot Diamond Solution Partner specializing in business intelligence and executive reporting.
Book a HubSpot consultation with Amwhiz today. We'll design executive dashboards that give your leadership team the insights they need to drive business growth.